GIS/map-objects for alternative versions of the model.
Examples
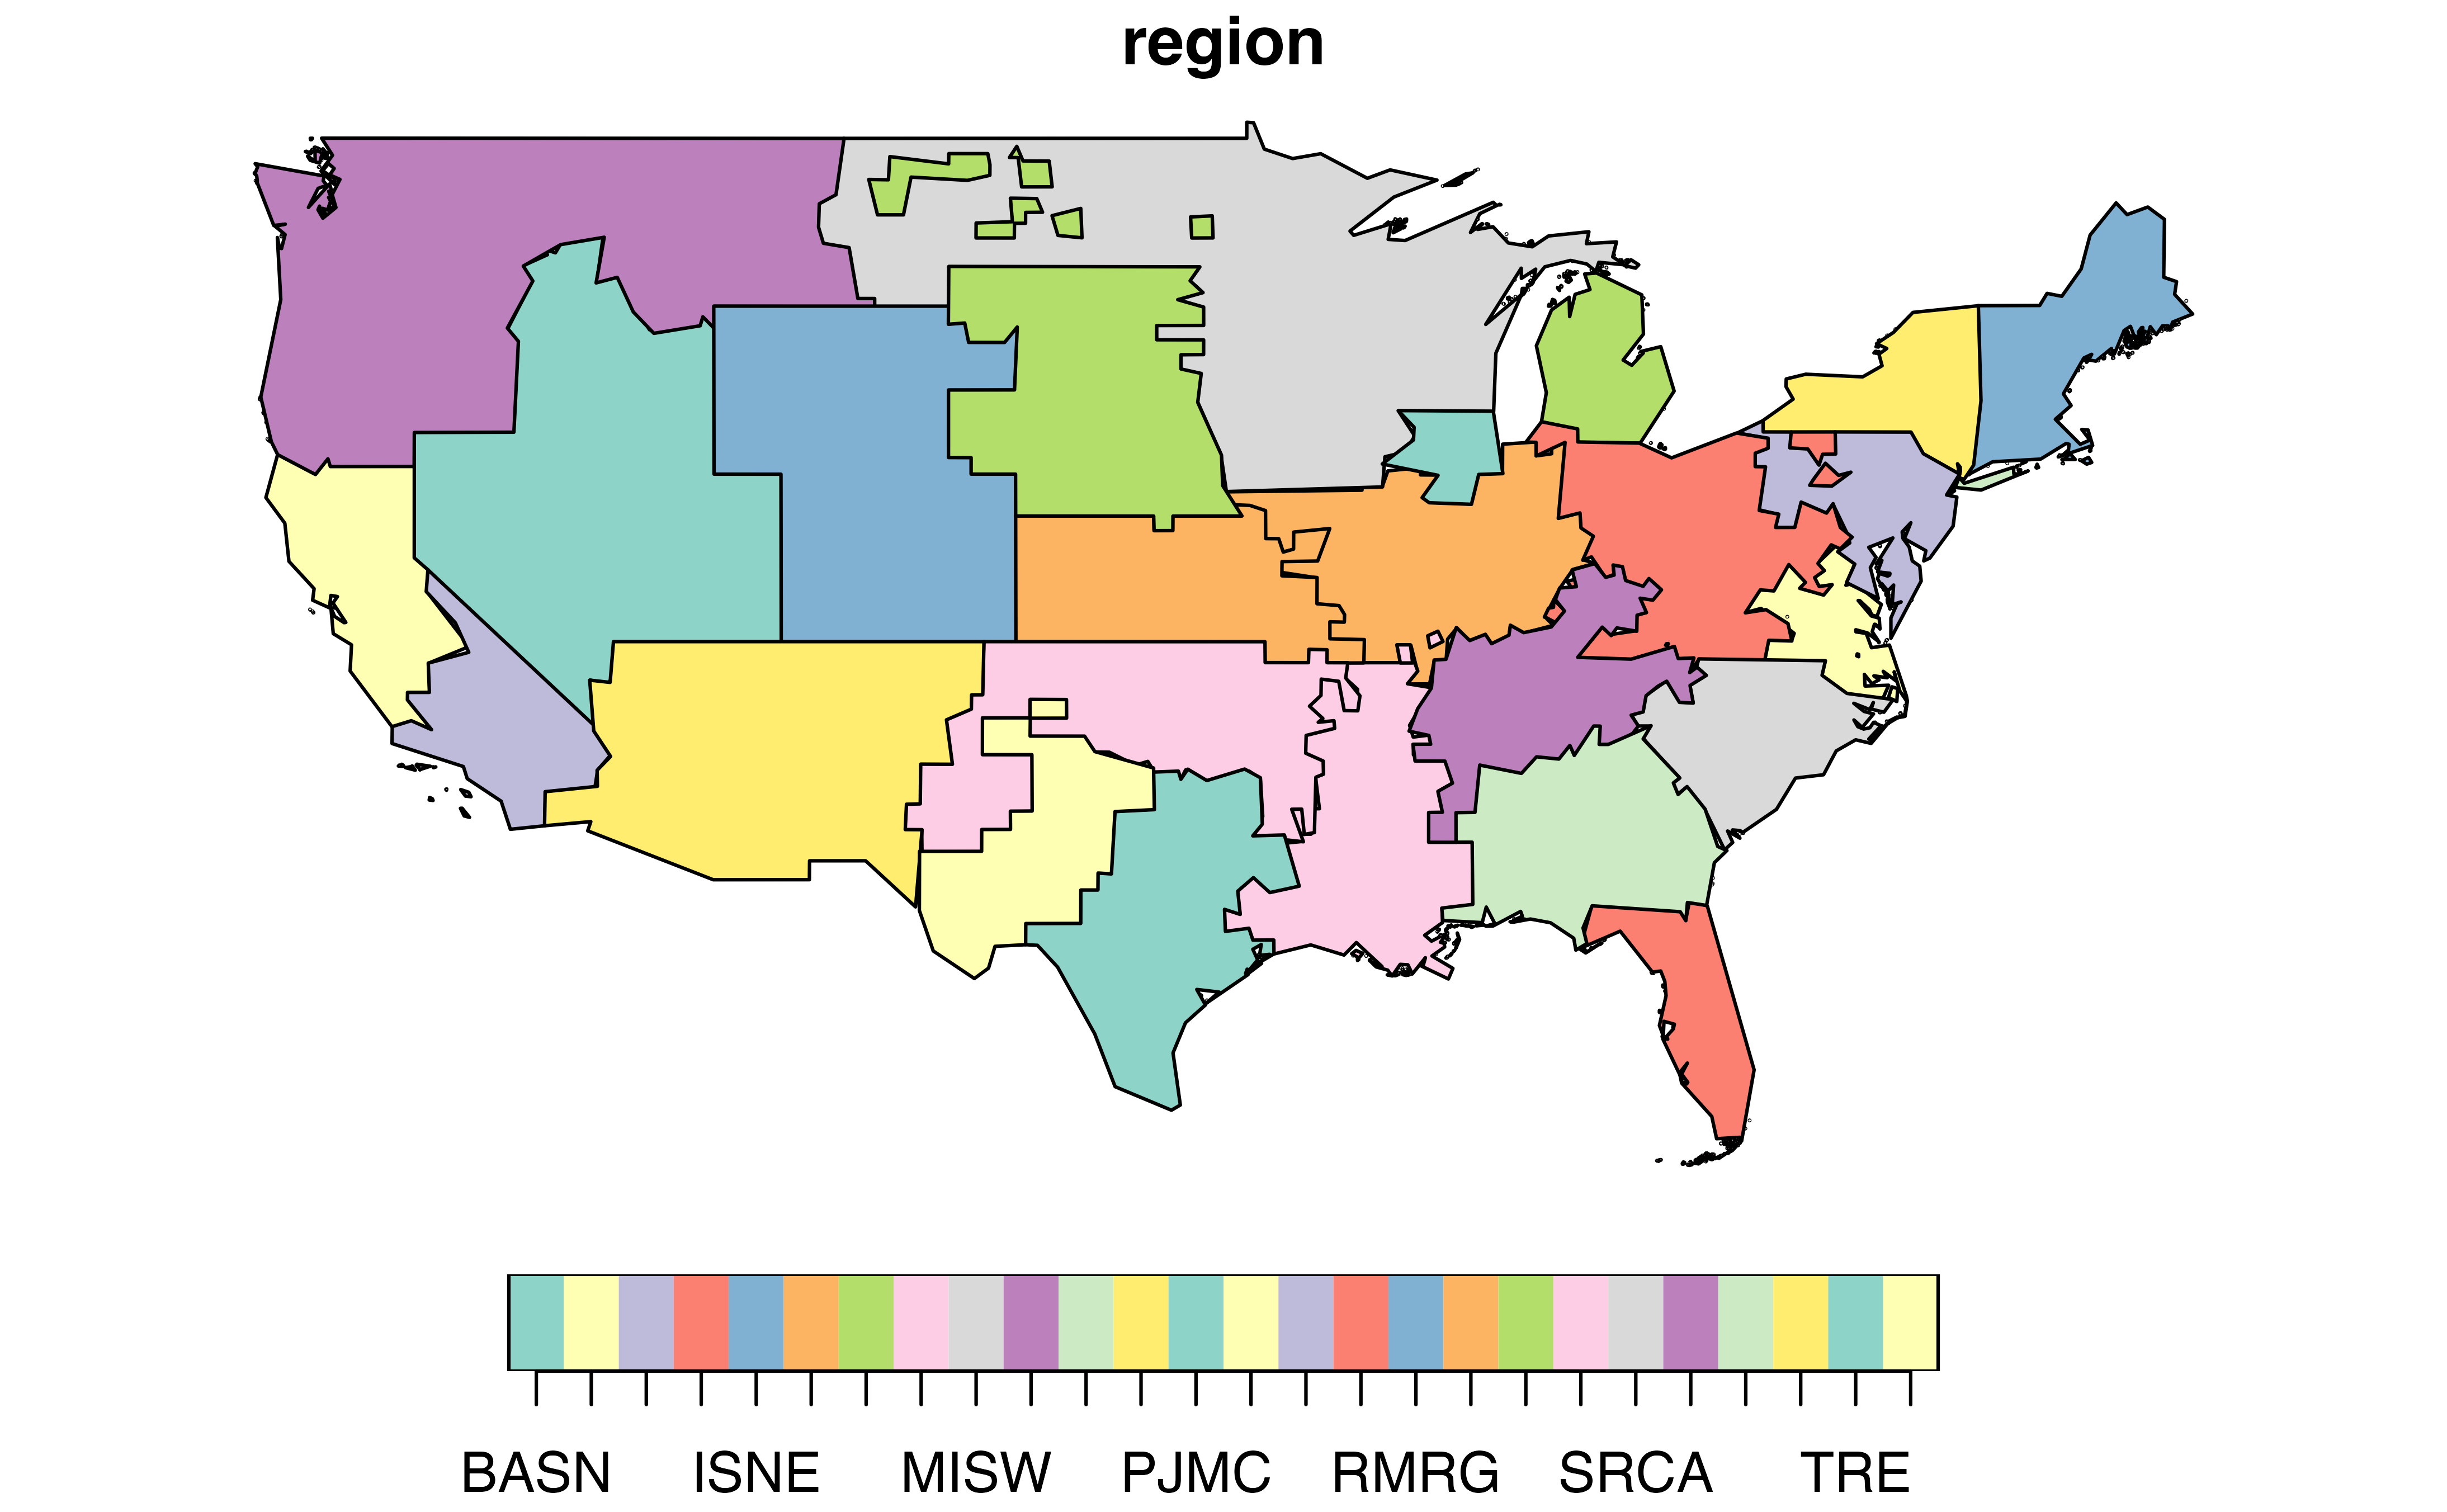
# Plot with base R
plot(usensys_maps$us26_sf["region"])
 # Plot with ggplot2
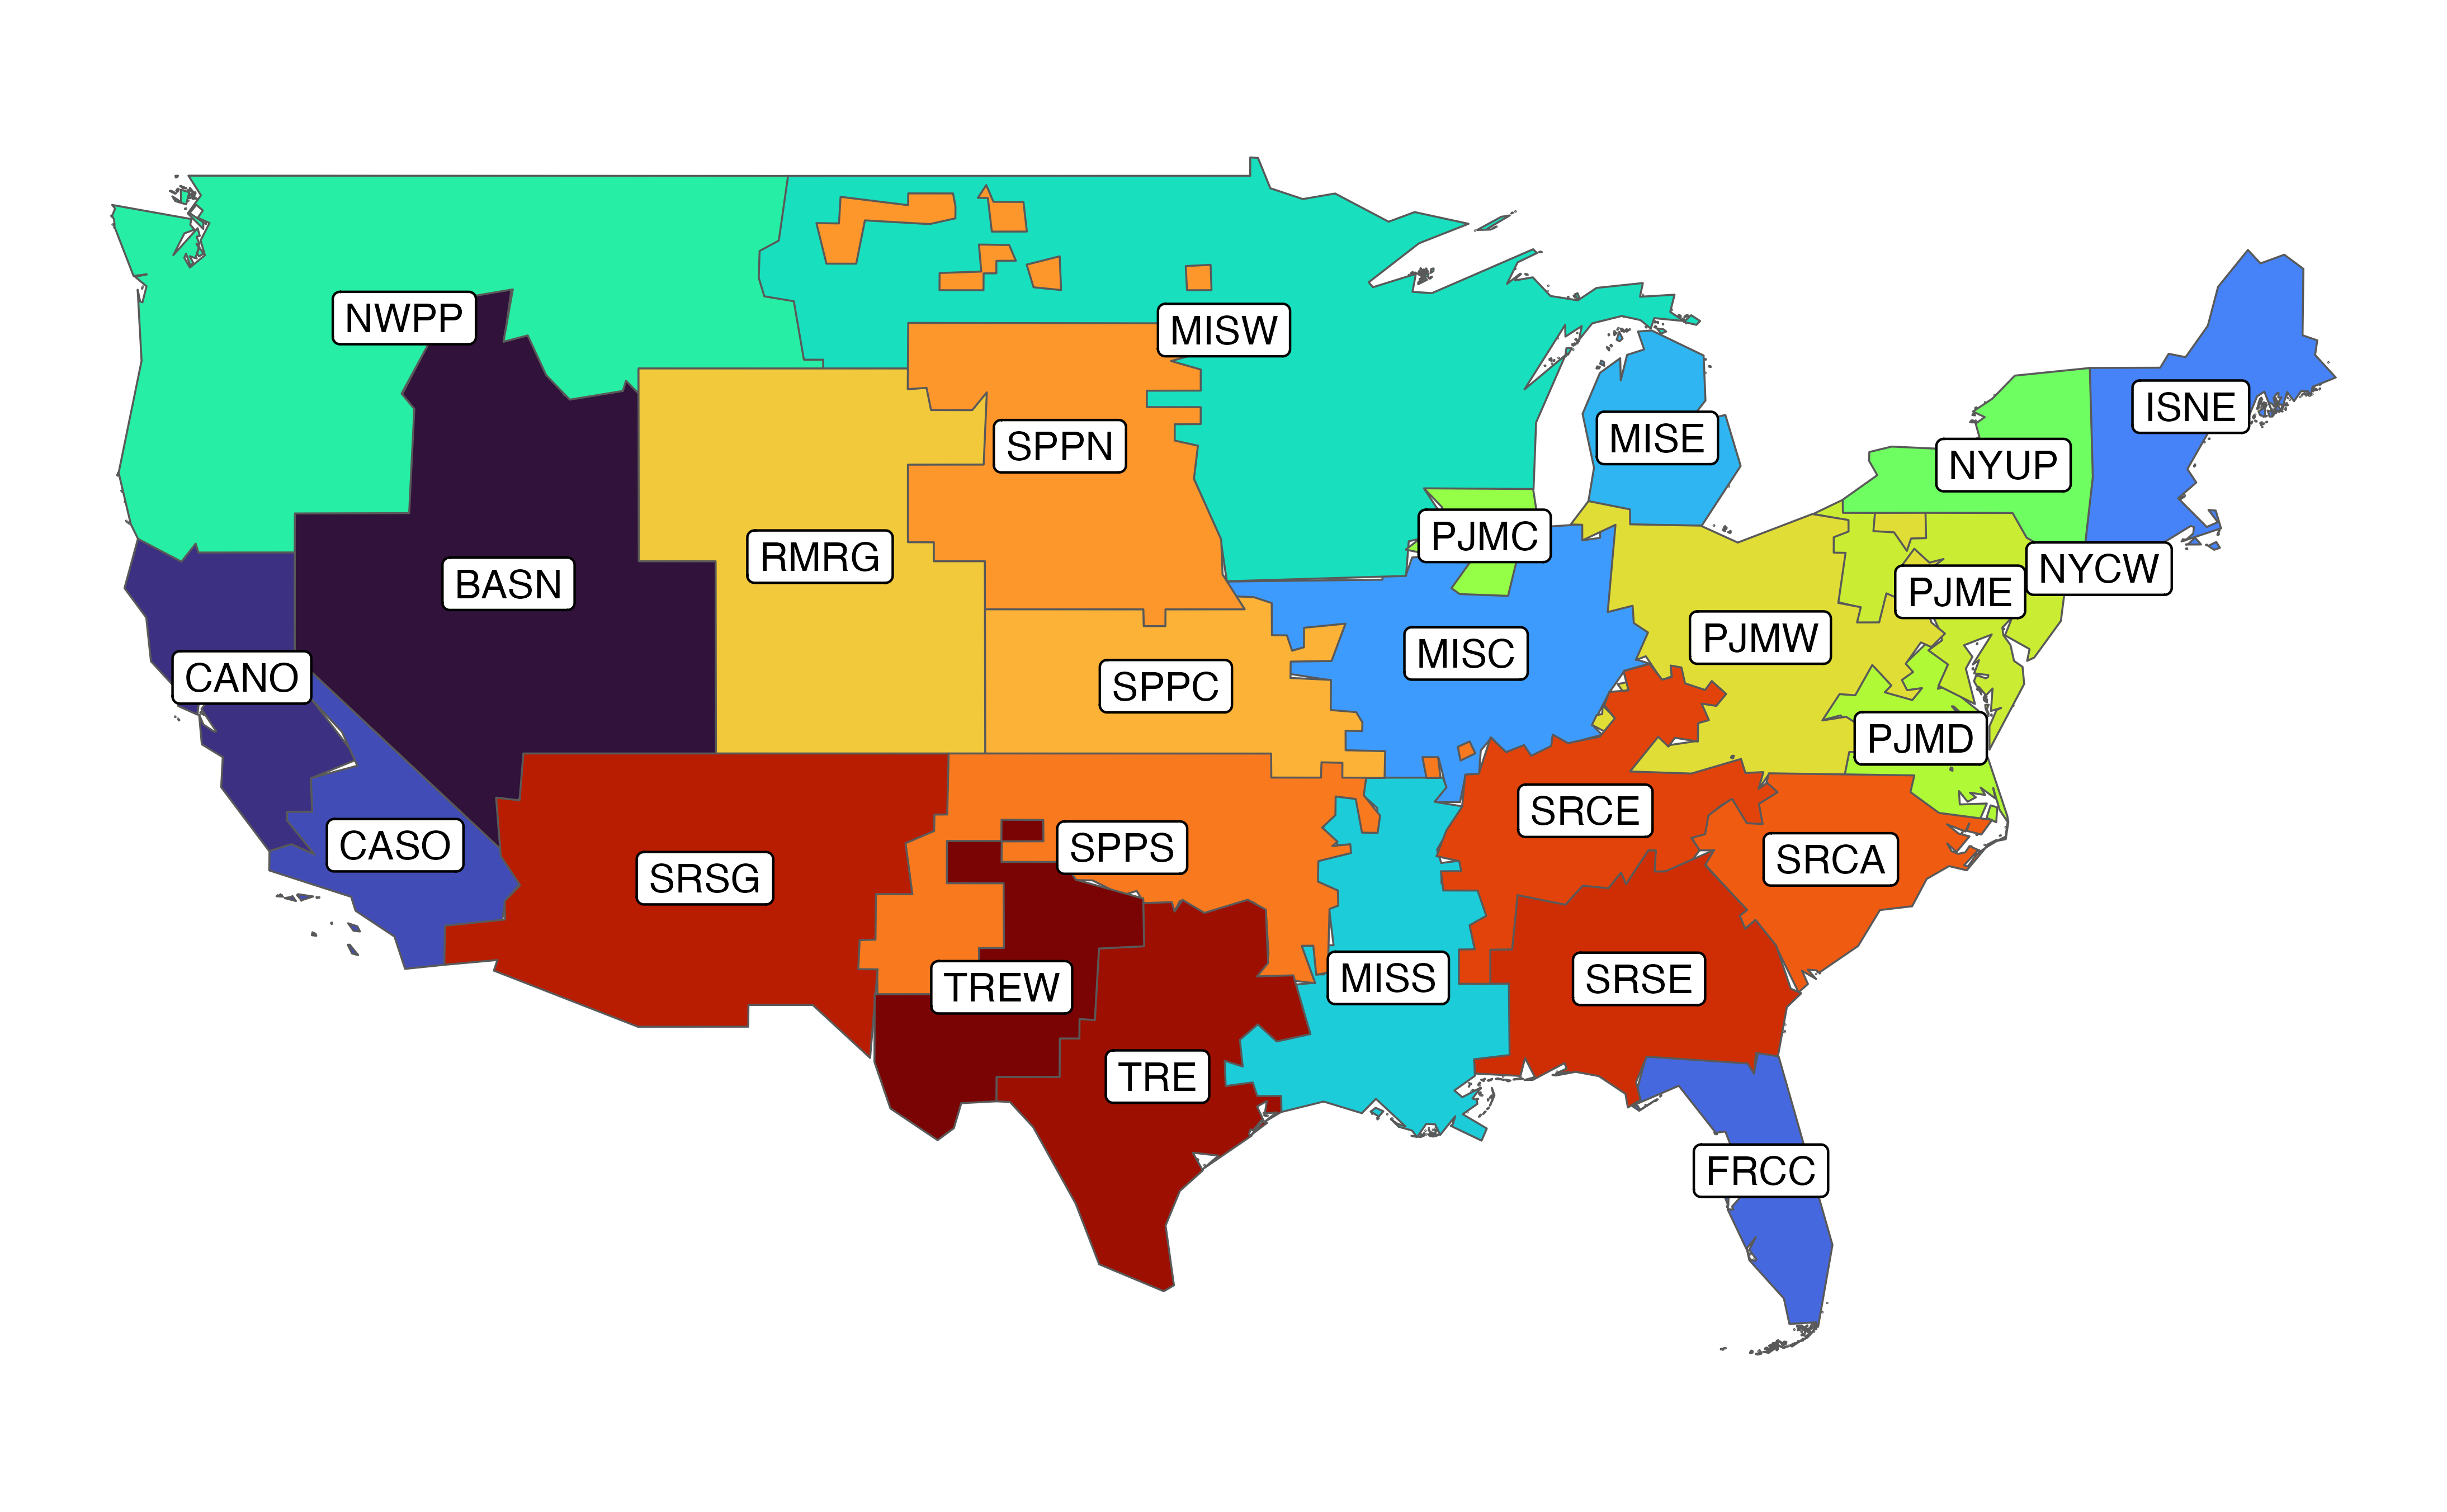
library(ggplot2)
ggplot(usensys_maps$us26_sf) +
geom_sf(aes(fill = region), show.legend = F) +
# geom_point(aes(x = centr_lon, y = centr_lat), color = "red", shape = 20) +
geom_label(aes(x = centr_lon, y = centr_lat, label = region), size = 3) +
scale_fill_viridis_d(option = "H") +
labs(x = "", y = "") +
theme_void()
# Plot with ggplot2
library(ggplot2)
ggplot(usensys_maps$us26_sf) +
geom_sf(aes(fill = region), show.legend = F) +
# geom_point(aes(x = centr_lon, y = centr_lat), color = "red", shape = 20) +
geom_label(aes(x = centr_lon, y = centr_lat, label = region), size = 3) +
scale_fill_viridis_d(option = "H") +
labs(x = "", y = "") +
theme_void()